„Designers are educators. Educators are designers.”
(Krummeck, 2018, online)
Design has always played a role in knowledge dissemination, starting from designers like Marie and Otto Neurath, who focused on educating the working class (cf. Gesellschafts- und Wirtschaftsmuseum, n.d., online) to modern infodesigners like Mona Chalabi. (cf. Chalabi, 2023, online) Many creatives have taken it upon themselves to share knowledge through graphics and illustrations.
Katie Krummeck argues that creatives working with "human-centered design" approach tasks with a beginner mindset, focusing on facts and the individuals involved. (cf. Krummeck, 2018, online) Without emphasizing their own opinion or expectation too much, they concentrate on the facts and the people involved. They also focus on action and are open to ambiguity. They value an iterative process with regular feedback rounds and are accustomed to collaborating with people from various fields. All of these are prerequisites that are also important in knowledge dissemination. (cf. ibid.)
Infodesigner Maria Illie describes the process as follows: sift through data (which is abundant), find the main insights, visualize them, and share them with others. This way, one has the opportunity to help others see certain topics more clearly. (cf. Illie, 2019, online)
"The Intergovernmental Panel on Climate Change" provides more specific advice on creating infographics. First, one should be aware of what insight they want to convey, who the target audience is, their current level of knowledge, and what information is important to communicate knowledge in a thorough and transparent manner. The design should be tested for effectiveness and understanding through regular feedback. (cf. Gomis/Pidcock, 2018, online)
Rare provides a fitting example: "Nobody wakes up in the morning saying, 'what a great day for some decarbonization.'" Instead, it is suggested to use the everyday language of the target audience. For example, using "extreme weather" is better than "climate change," and "air pollution" is more understandable than "emissions". (cf. ibid.)
Julian Schmitt identifies schools and universities as particularly good places to share information, as they are where future leaders and consumers are located. But social media can also play an important role, as many young people spend time there. (cf. Schmitt, 2022, online)
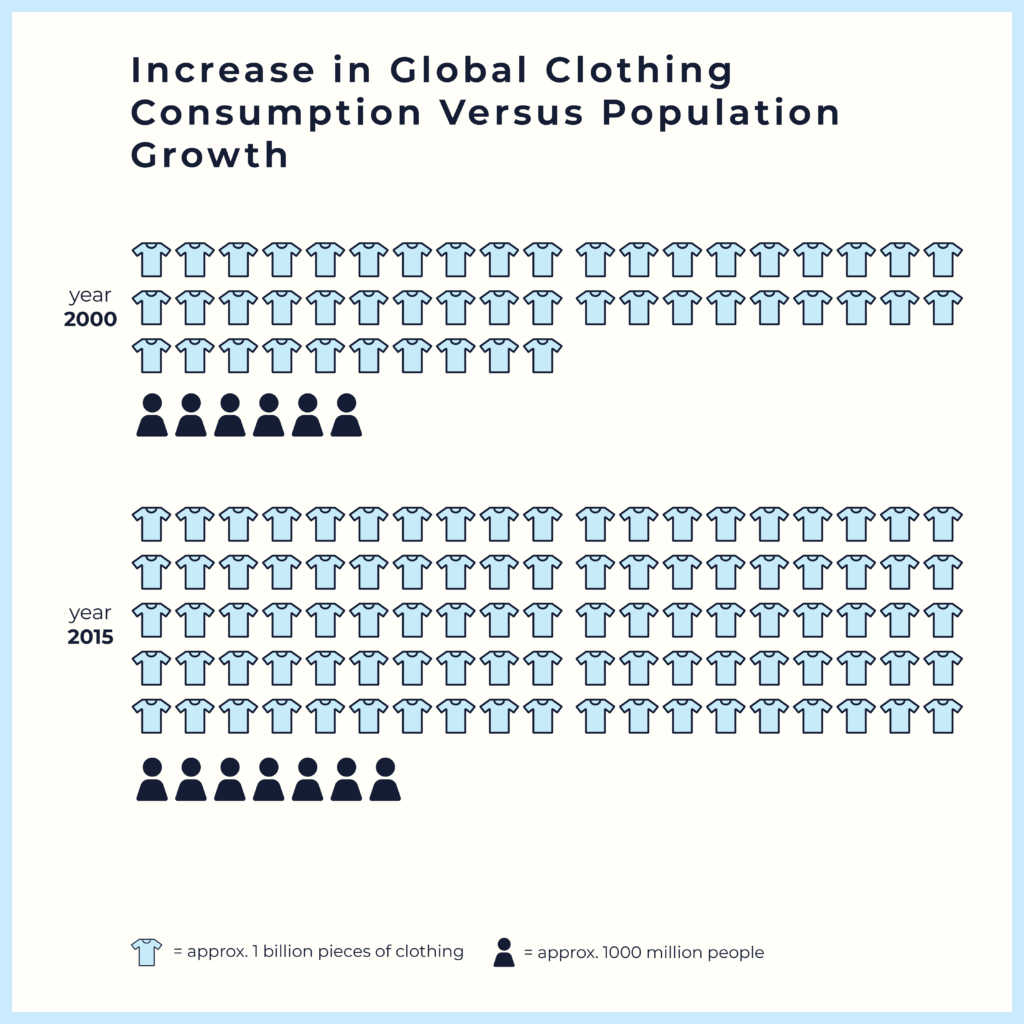
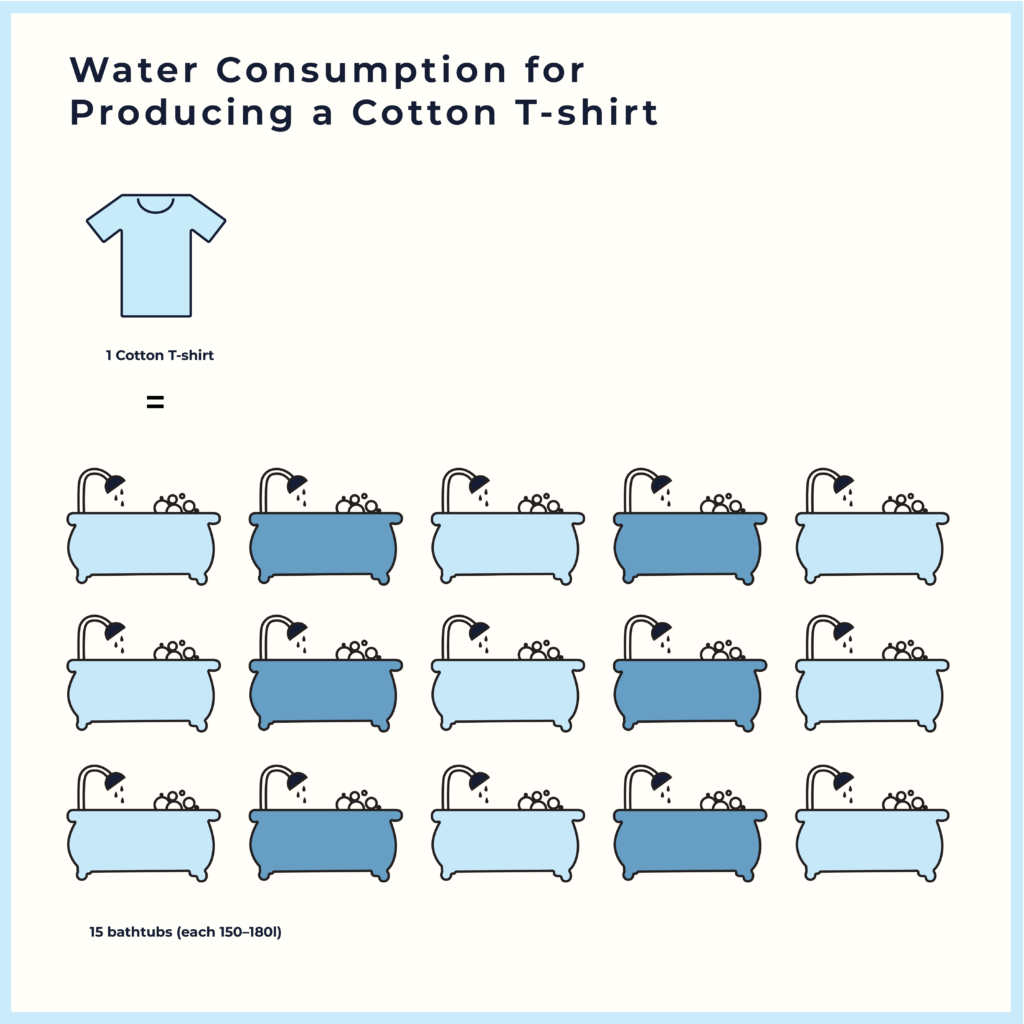
The Second Hand Boutique I collaborated with, works closely with the local high school, as it is located directly across the street. For example, students participated as models in the intergenerational fashion show. Workshops with other local schools are also planned. On social media, we share infographics and consider it a success when these are shared or commented on.


In communicating about the sustainability of their own brand, transparency should be paramount, as citizens have become increasingly uncertain due to greenwashing in recent decades. (cf. Schmitt, 2022, online) According to futureform studio, it is therefore particularly important to communicate how sustainable impact is achieved and how it is measured, not just what the sustainable impact is. (cf. Futureform Studio, n.d., online) This should be revisited regularly. Transparency also means admitting what is not yet sustainable in the company. (cf. ibid.)
By simultaneously outlining a plan to address these shortcomings, trust in environmentally friendly organizations and companies can be restored. Videos and infographics can also help make content accessible to a wider audience, compared to often "hard-to-digest" annual reports. (cf. ibid.)
(This was a translated excerpt of my Master Thesis)
Sources:
Krummeck, Katie (2018) Designers are Educators. Educators are Designers. What Happens When the Best of Both Worlds Collide? In: The School of Texas at Austin, School of Design and Creative Technologies, https://designcreativetech.utexas.edu/designers-are-educators-educators-are-designers-what-happens-when-best-both-worlds-collide (zuletzt aufgerufen am 26.07.2023)
Gesellschafts- und wirtschaftsmuseum (o.D.) Otto Neurath – Sprechende Zeichen. Dauerausstellung. In: https://www.wirtschaftsmuseum.at/website/article/id/einzelbesucher_innen_otto_neurath_sprechende_zeichen
Chalabi, Mona (2023) About. In: https://monachalabi.com (zuletzt aufgerufen am 09.10.2023)
Ilie, Maria (27.12.2019) How Data Visualization Helps Us See the Effects of Climate Change: Mapping techniques highlight how quickly the glacier margins in Glacier National Park are receding. In: Medium, https://www.goodenergystories.com/playbook/positive-climate-futures-can-make-for-good-stories (zuletzt aufgerufen am 31.07.2023)
Gomis, Melissa I./Pidcock, Roz: An IPCC Visual Style Guide For the Authors. In: https://www.ipcc.ch/site/assets/uploads/2019/04/IPCC-visual-style-guide.pdf (zuletzt aufgerufen am 31.07.2023)
Schmitt, Julien (03.02.2022) Closing the ‘green gap’ to create sustainable value. In: the choice, https://thechoice.escp.eu/tomorrow-choices/closing-the-green-gap-to-create-sustainable-value/ (zuletzt aufgerufen am 31.07.2023)
Futureform Studio (o.D.) Branding für nachhaltige Unternehmen. In: Skillshare, https://www.skillshare.com/de/classes/Branding-fur-nachhaltige-Unternehmen/1193270280 (zuletzt aufgerufen an 01.08.2023)

No comments.